How to Put Real Evidence Behind Your KPIs (feat. FP&A)
A KPI without evidence is just a wish. Here's how to set KPIs on a strategic foundation — and how to automate the whole thing with Numen.

"Why did you set this number as the target?"
If someone asked you that, how would you answer?
"It's 10% more than last year." "Looking at the revenue target we set for the year and how the first half came in, this felt like what we'd need to do in the back half."
Familiar answers — but not good enough. Of course, there's a counterargument too:
"You can't model every uncertainty. A KPI is just an agreed-upon target — it was never meant to be a perfect forecast."
Still, in a shifting environment, a number needs "evidence" behind it to respond properly — and building that evidence is exactly the job of FP&A (Financial Planning & Analysis).
Traditional accounting metrics aren't built for "forecasting"
The core job of traditional accounting has always been to "record financial activity accurately and produce financial statements for external reporting." Statements like the income statement (P&L), balance sheet (BS), and cash flow statement (CF) exist to report against accounting standards.
But these metrics fundamentally deal with the "past." You can use them as "reference data," but they're limited when it comes to designing actual future strategy.
So with traditional financial metrics alone, you can say
"here's where our company stands, this went well, this didn't" — but questions like
"How, why, and with what are you going to move this metric?"
"On this newly set KPI, why is that the target number?"
"Is this metric actually doing well?"
are hard to answer clearly.
POV: What do they see in the numbers? Finance/accounting team vs. FP&A
FP&A looks at the same ledger as a traditional finance or accounting team — but interprets and reshapes it differently.
A quick comparison of how the two see things:
Dimension | Accounting team | FP&A team |
|---|---|---|
Focus | Settling past results | Building future strategy |
Metrics used | Statutory accounting metrics — revenue, costs, profit/loss | EBITDA, ROIC, KPIs, scenario-based forecasts |
Core work | Monthly results reporting, financial-statement preparation | KPI setting, budgeting, forecasting and analysis |
Purpose | Reporting and compliance | Supporting strategic decisions |
From this lens, when a number like "March revenue of ~$1M" lands,
an accounting team operates with monthly results and reporting as the main goal,
while an FP&A team treats that number as a metric for management decisions and asks the practical questions:
A given segment's revenue grew — so why did operating margin fall?
Is retaining existing customers more important than acquiring new ones?
Within SG&A, which costs are fixed and which are variable?
When building the budget, how well does historical data actually reflect reality?
Rather than fixating on a single KPI, how do we weigh the trade-offs between KPIs?
How FP&A sets KPIs grounded in data
So how does an FP&A team set a KPI and build the structural conditions to hit it? Here's a simple walkthrough of the FP&A workflow, by example.
FP&A's KPI design process
Situation: revenue grew, but the growth in net income slowed
Step | Key question | Example | Output |
|---|---|---|---|
① Define the target metric | Why this KPI? | Revenue rose 15%, but a spike in raw-material prices pushed variable costs (COGS) up faster than revenue, leaving EBITDA flat | Set EBITDA improvement as the KPI |
② Decompose the components | What line items make up this number? | EBITDA = Revenue − COGS − SG&A | List of KPI component line items |
③ Analyze impact | Which line item moves the number the most? | Marketing spend within SG&A up 30% → CAC rising, ROI falling | Marketing-spend efficiency is the lever |
④ Design the conditions | What conditions are needed to hit the KPI? | Keep CAC at or below ~$300; hold fixed-cost ratio at or below 45% | KPI attainment scenario & action plan |
How to use Numen for FP&A
As we've seen, FP&A designs a KPI not as a bare number but as the structure of an executable strategy.
But keeping that process running by hand — or responding to a fast-changing business environment in real time — isn't easy.
There are a lot of numbers tied to a financial KPI, and they're all interconnected — ignore that and
you get bad forecasts and bad outcomes.
Many companies that want to adopt FP&A run into complexity and the limits of manual work when they try to put it into practice.
Numen extracts data from your ERP ledger and automates the structural design, helping you execute the core FP&A workflow fast and accurately.
✅ What Numen does for FP&A
Data integrity checks
Using your ERP ledger data as the source, it automatically detects errors or gaps before any metric is calculated.

Budgeting and financial forecasting
Build budgets around your KPIs (operating income, EBITDA, etc.) and forecast revenue, cost, and profitability scenarios.
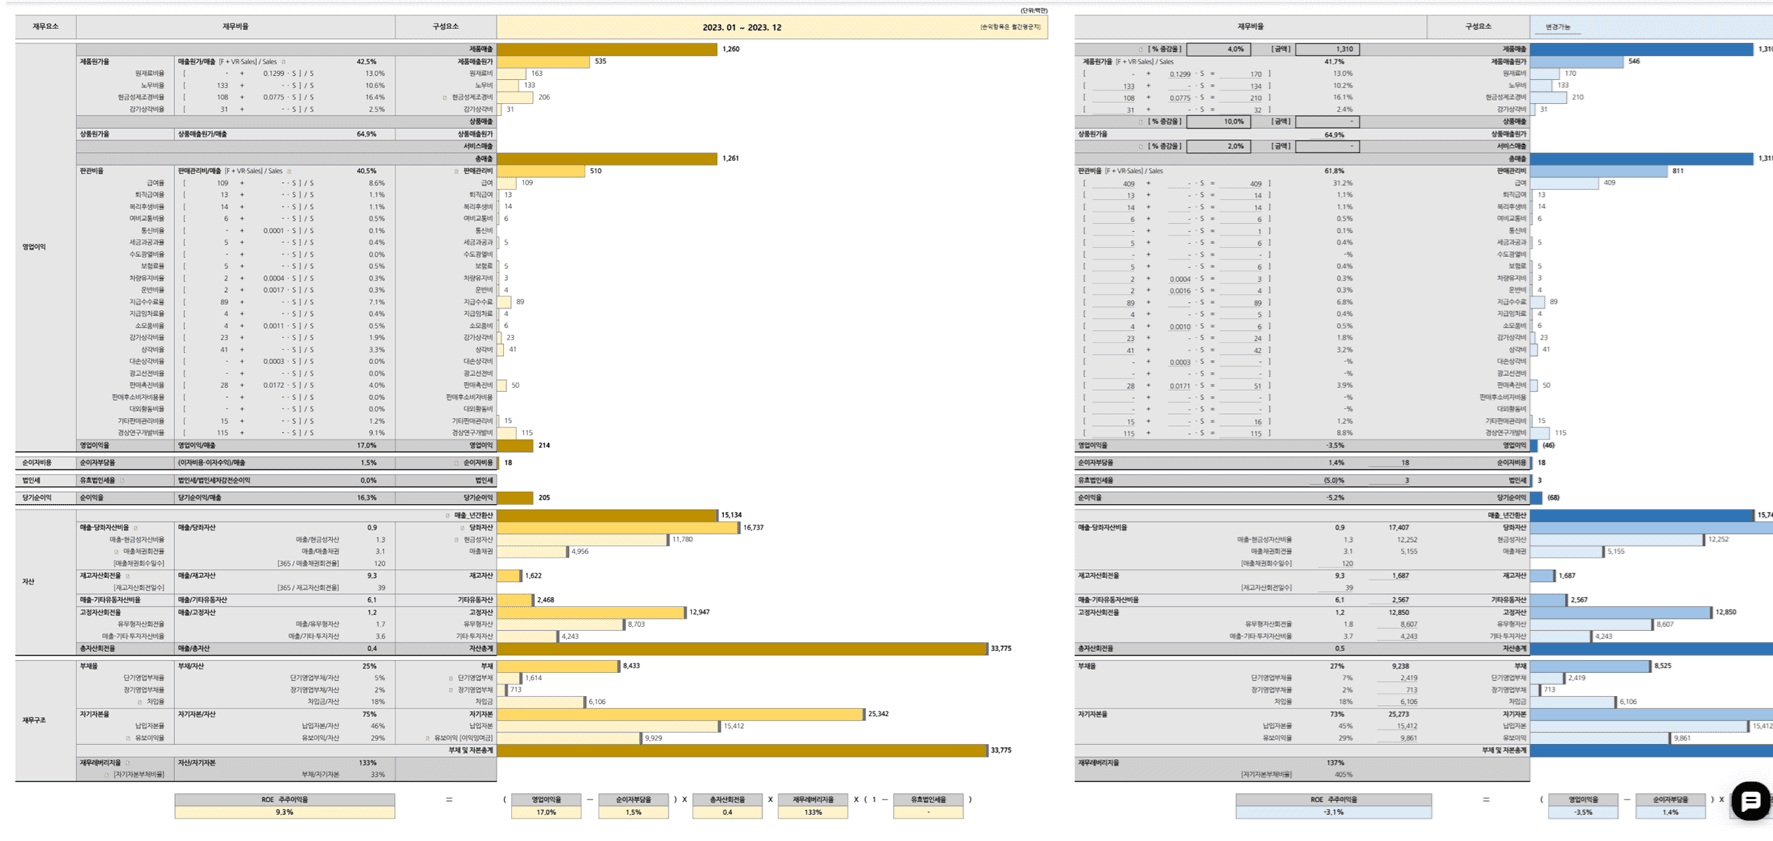
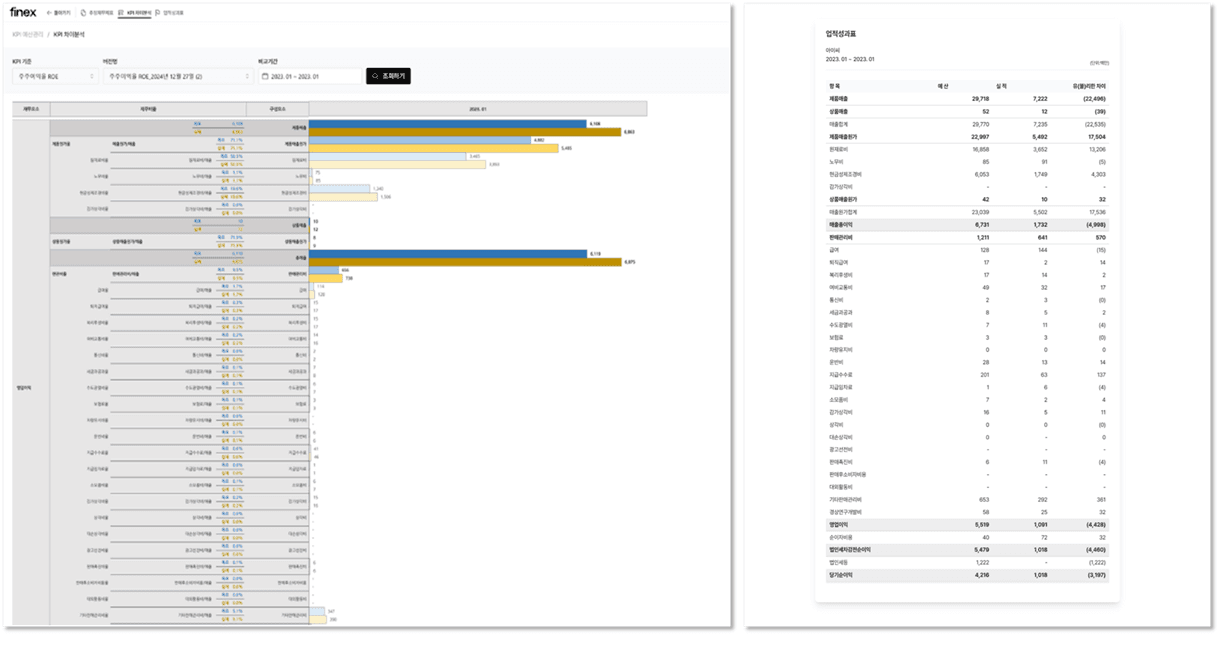
Performance evaluation by KPI
Analyzes variance between KPI target and actual and breaks down the causes line by line.
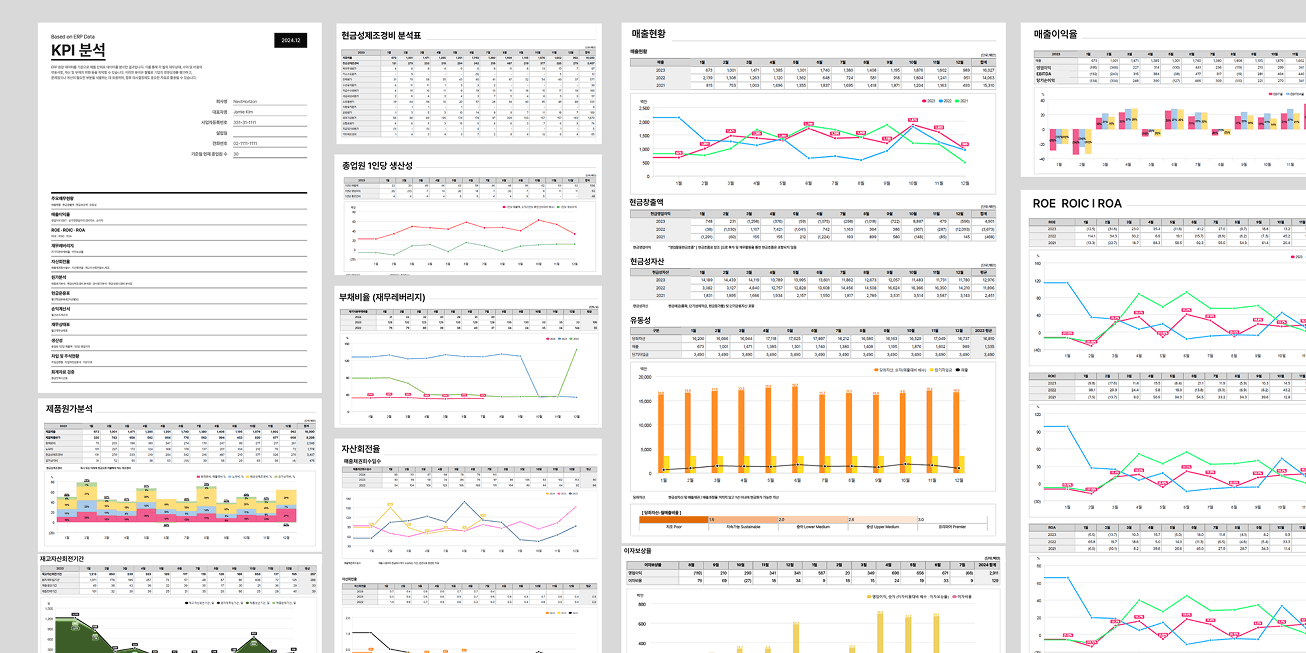
KPI reports
Auto-generates reports built on your ERP ledger data, covering every financial metric that can be analyzed.
Run the full FP&A flow — KPI → budget → actuals → forecast → reporting — in one place
Connect not just the number design but evidence-based strategy and execution-scenario analysis
Respond to financial data as conditions shift and set KPIs flexibly
Your company's KPIs need to stop being mere "target numbers" and become "achievable strategy." Start that shift with Numen.
✨⚙️ Want to bring FP&A AI into your finance function?
Get FP&A insights validated on the floor — delivered every Tuesday morning.