Working with the Canvas
Every agent page is a Canvas — the workspace where AI results land, and where you verify, manage, and edit them.
The Canvas is the surface every agent page is built on — the place where the results of what you ask the AI arrive, get verified, and get edited. Ask for an analysis and the answer lands here as live widgets. Open the Budget agent and the canvas holds a budget template you edit directly. Open Anomaly Detection and it shows the detection results for you to review. It is not a locked-down dashboard: the canvas is where you see, check, manage, and change what the AI produced — before you make it final.
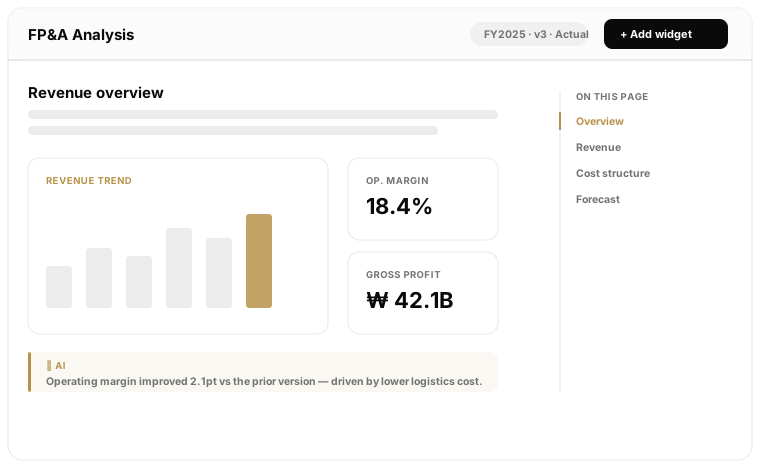
One canvas, many shapes
- FP&A Analysis & Reporting — compose analysis views and reports from text and live widgets.
- Budget Planning — a budget template lives in the canvas; you fill it, adjust it, and confirm a version.
- Anomaly Detection — the detection results appear on the canvas for you to review and resolve.
- What-if Simulator — move the levers and compare scenario outcomes side by side.
The shape changes with the agent, but the rule is the same everywhere: what the AI proposes shows up on the canvas, and you verify and edit it there before it becomes final.
Composing with blocks
When you compose an analysis view or a report — mixing text, tables, and widgets like a document — the canvas works as a block editor. That workflow lives in the reporting workbench: see FP&A Analysis & Reporting.
The canvas header
Every canvas has a header running across the top. It holds the page title, the + Add Widget button, and the context filters for period and entity that decide which data every widget shows. It also displays the save status, and a "more" menu for exporting or saving the page as a template.
Adding a widget
Select + Add Widget to open the Widget Insert popover. It has four tabs so you can find the right block whether you know exactly what you want or are just browsing.
- 1Select + Add Widget in the canvas header.
- 2Choose a tab — Suggested (recommended for this view), KPI (25 KPIs by category), Library (your saved widgets), or All widgets (the full catalog, with search).
- 3Pick a widget to insert it into the canvas.
- 4Adjust its period, entity, or filters in the widget's settings.
The outline (On this page)
On the right, an outline / "On this page" table of contents lists the headings on your canvas. On a long page it is the quickest way to jump straight to a section. When a canvas is blank, you will instead see an empty state prompting you to add your first block.
Moving, deleting, and saving
Each widget sits in a frame. Hover over it to reveal a drag handle (to move it), settings, and delete. Drag a widget by its handle to reorder it on the page.
The canvas auto-saves as you work — the header's save status tells you where things stand. When a page is worth keeping, set up an external share link to share it with people outside your team, or save the layout as a template so you can reuse the same structure on another entity or period.