Widgets & the Library
Widgets are live data blocks where every metric is defined. Configure them, build your own — AI answers never leave their logic.
A widget is a reusable, live block of data you place on a canvas. Unlike a static chart pasted from a spreadsheet, a widget refreshes from your data on its own — so a P&L Summary or a Revenue Trend always reflects the latest numbers for the period and entity it is set to. Widgets are also where every metric in Numen is defined: each one carries its own calculation logic, and you can open it at any time to see exactly how a figure is computed.
The four categories
Numen ships the built-in widgets an FP&A and management-accounting team needs, grouped into four categories so you can find the right one fast. And you're not limited to them — you can build custom widgets for the metrics your team defines.
| Category | What it is for | Examples |
|---|---|---|
| Analysis | Break down and compare performance | Cost Analysis, Contribution Margin, FX Impact Bridge |
| Reporting | Present results in statement form | P&L Summary, Cash Flow Statement |
| Monitoring | Watch for changes and exceptions | Anomaly Alert, Entity Watch/Heatmap, KPI Card |
| Data | Show the underlying rows and forecasts | Data Table, AI Forecast, Scenario Comparison |
Metrics with guardrails
Widgets aren't just visuals — they are Numen's metric definitions. When an agent or the AI chat answers with numbers, it composes the answer from these widgets, so the result never drifts from the metric and calculation logic you've defined. That is what keeps AI answers verifiable instead of black-box: open the widget behind any figure and you see exactly how it was computed.
And widgets don't stay on the canvas. They render inline inside chat answers, and you can place them directly into the Report agent (FP&A Analysis & Reporting) as report blocks. Wherever a widget is used — a chat reply, a canvas, a finished report — the same definition produces the same numbers.
Inserting and configuring
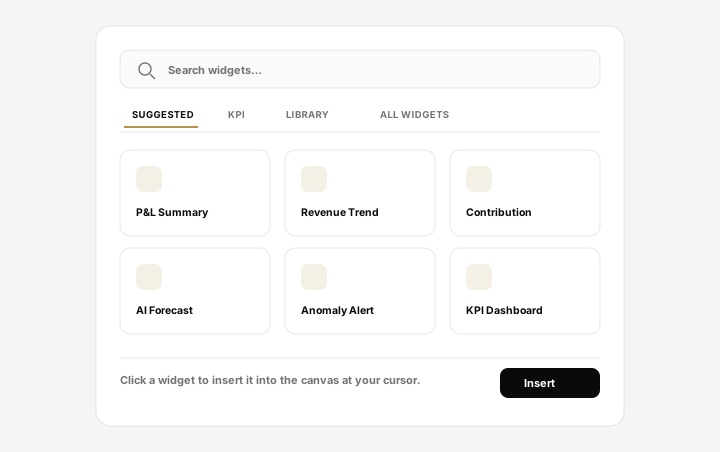
Add a widget from the + Add Widget popover on the canvas (see Working with the Canvas). Once placed, every widget is configurable: set its period, entity, and filters in its settings. Change these and the widget re-reads your data and redraws — no formulas to maintain.
Cross-widget filters
Widgets on the same canvas can talk to each other. With cross-widget filters, clicking an entity in one widget filters the others to match — so selecting a subsidiary in an Entity Overview instantly narrows every chart on the page to that subsidiary. It turns a page of widgets into a connected, drill-down view.
Edit widgets with AI
Every widget has an AI editor: describe what you want in plain language — "two decimal places," "add a 3-year trend chart," "switch the unit" — and the AI builds the change, verifies it, and saves it automatically, with a live preview beside the conversation. It's the fastest way to customize an existing widget or shape a new one.
Custom widgets & your Library
When you configure a widget just how you like it — or build a custom widget for a metric that isn't in the catalog — save it to your Library with a name, category, and description. Saved widgets then appear in the Library tab of the insert popover, ready to drop onto any canvas, and they carry their calculation logic with them wherever they're used. Register external data as widget data in the File Manager and it becomes a source your custom widgets can read.